
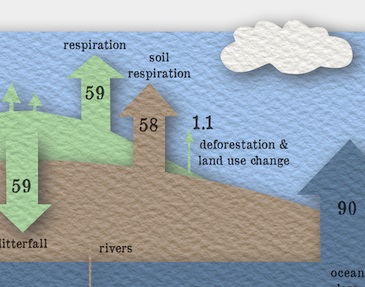

OK, strictly speaking it’s not origami, since there are no folds, but here is a visualisation of the global carbon cycle using a paper cut-outs motif. Forests and the carbon cycle are strongly linked since they do most of the photosynthesis that takes carbon dioxide out of the atmosphere. They also respire, and their litter decomposes, so they do add carbon dioxide back into the atmosphere as well. The graphic explains why I used a paper cut-out motif.
Note that unlike most other carbon cycle graphics available on the web, this one is “in proportion”: the size of the bits of paper that are visible are approximately proportionate to the total carbon stored in those pools, and the thickness of the arrows are in proportion to the fluxes (the moving of carbon between the pools).
Please use and share this graphic. It is under a creative commons licence, which pretty much means you can use it for any purpose other than re-selling it, as long as you give a link back to this blog. It is 9Mb in bitmap format and 5Mb in PDF, so be patient if you have a slow connection.
Use this link to the PDF VERSION if you want to print it out.
NEW!! Use this link to the PDF TEMPLATE version if you want to print it out, cut out the shapes, and stick them together yourself, or in a classroom.
My other attempt at infographics can be seen in these previous blog entries:
The numbers I used for the carbon cycle come from a Nasa graphic:
http://www.nasa.gov/images/content/544800main_globe-CarbonCycle-hi.jpg

Nice visualization. This is of great interest to a committee that I manage in British Columbia. They are wondering however, how the carbon budget works out in this. The graphic indicates that 215.8 Pg of C are released but 271 Pg are stored. Is that correct?
Note that “litter fall” is a flux from Plants to Soil, not from atmosphere to soil.
Thanks, yes that makes sense.
Does your photosynthesis number include photosynthesis by ocean-dwelling plankton? If so, do you know what the forests vs oceans split is?
I love this! Do you have a template for this do I could make one for my classroom?
Coming soon! 🙂
Yes, a template for the parts would be excellent. Having kids work with this, manipulate it, and assemble it would make it all the more meaningful.
To take it further, there’s a great interactive for working with the carbon cycle from Challenger.org– see http://ccearth4u.challenger.org/
I have added a link above to a template version — two pages in a PDF with the different elements. Let me know if it works OK.